DOSSIER 002 · FIELD NOTES
Vulnerability trends: 26 October to 1 November 2026
3,451 vulnerabilities were reported publicly last week, down 16% on the week before. One quiet week doesn't change a trend that's running at nearly four times last year's pace, and AI tooling keeps climbing.
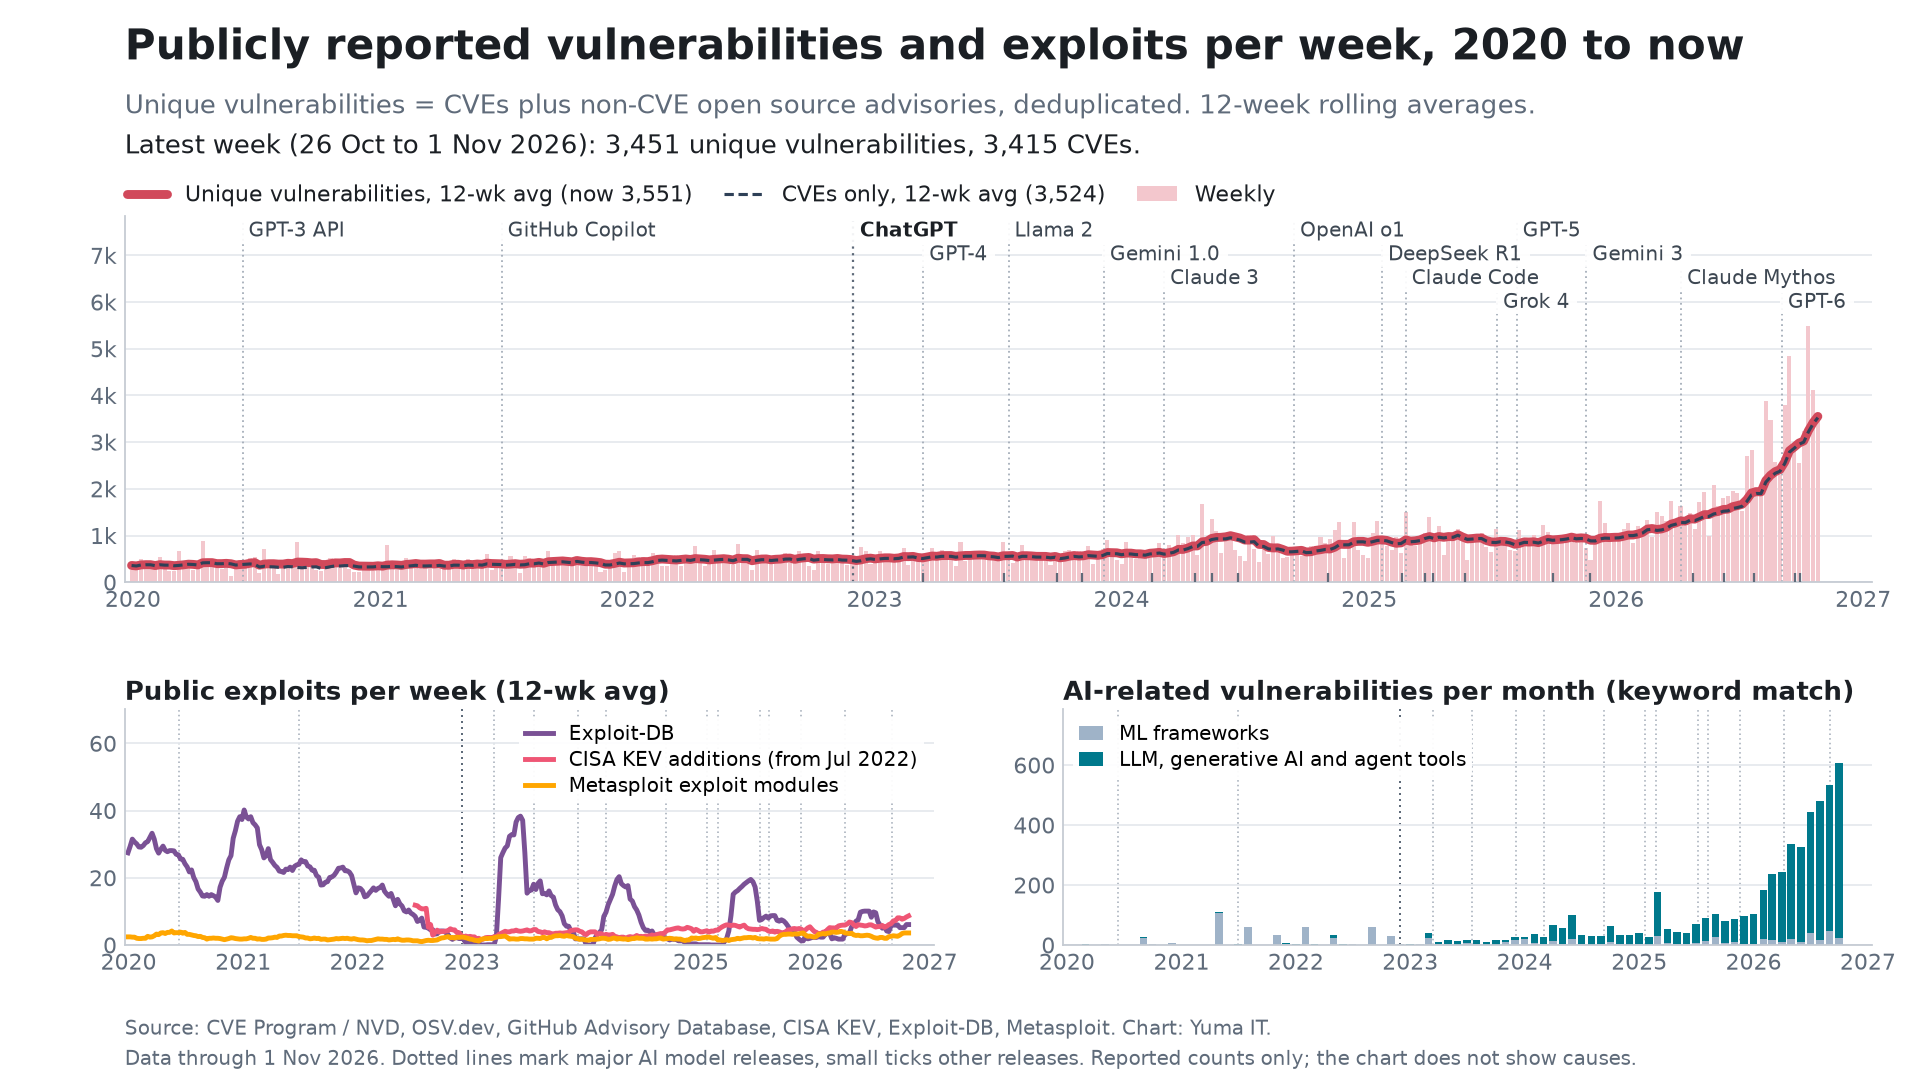
Last week's numbers
In the week of 26 October to 1 November 2026, 3,451 unique vulnerabilities were reported publicly. That counts CVEs plus advisories that never got a CVE. It's 676 fewer than the week before (4,127), a drop of about 16%.
Of those, 3,415 were CVEs. Severity at the time of this run looked like this:
- 264 critical
- 973 high
- 1,235 medium
- 153 low
- 790 not yet scored
That last number matters. Nearly a quarter of last week's CVEs had no score from anyone yet, so if your process waits for a score before it acts, a lot of the work is sitting in a queue.
Why one quiet week doesn't mean much
The 12-week average is about 3,551 a week. A year ago it was 965. That's an increase of roughly 268%.
Year to date there have been 91,299 unique vulnerabilities, up 127% on the 40,184 at the same point last year. Over the last 52 weeks the average was 1,921 a week. From January 2020 to November 2022 it was 427.
So last week was lighter than the one before, but it's still close to four times the volume of a year ago.
AI and LLM tooling
This is the part I keep watching. Matching by keyword on descriptions and product names, we counted 606 AI-related vulnerabilities in October 2026. In October 2025 there were 81. Most of October's (583) were in LLM, generative AI and agent tooling, with 23 in ML frameworks.
Over the trailing 12 months there were 3,676 AI-related vulnerabilities, against 789 in the 12 months before. That's about 3.7% of everything reported.
A related count: 24 CVEs published in October said in their description that the bug was found with AI help. Year to date that's 229, against none at the same point last year. That only counts explicit mentions, so treat it as a floor.
These are counts of what was reported, not an explanation of why. A keyword match will also have some false positives and misses.
Exploits and malicious packages
- 3 new Metasploit exploit modules landed last week, 139 year to date (up about 42%).
- Exploit-DB published none last week, and 234 year to date. It has published far fewer exploits since 2022, so that line says more about its intake than about exploit activity.
- 140 malicious open source packages were recorded last week, 18,250 year to date. Bulk imports of older reports distort the year-on-year comparison for this one.
What I'd do with this
If your patching process was sized for last year's volume, it's already behind. Severity scores alone won't sort this queue for you, especially when so many CVEs arrive unscored. Rank fixes by what's exposed in your environment and what's actually being exploited.
About the data
Data runs through 1 November 2026 (UTC), using ISO weeks starting Monday. Sources are the CVE Program (cvelistV5), NVD, OSV.dev, GitHub Advisory Database, Exploit-DB and Metasploit. Rejected CVE records are excluded, and weekly totals for recent weeks can rise a little as late records land. Severity scores can shift as NVD, CNAs and CISA add them. Chart by Yuma IT.